
Financial Alerts
Economic impact of current global threats on energy markets, precious metals, defense equities, and household finances.
Market data is sourced from the U.S. Energy Information Administration, IEA, commodity exchanges, and verified financial reporting. This page tracks threat-driven economic effects - not investment advice.
FINCOM Alert Flash
LIVELatest alerts with direct impact on energy markets, commodity prices, and household financial exposure.
- Oct 11 CENTCOM Disables Panama-Flagged Cargo Vessel Attempting to Run Iran Blockade in Gulf of Oman
- Oct 10 Outbound Tanker Struck by Projectile in Strait of Hormuz
- Oct 8 Category 1 Hurricane Isaias Strengthens in the Gulf of America and Heads for the Northern Gulf Coast
- Oct 4 Tanker Crew Reports Explosions 60 Nautical Miles South of Al Mukha, Yemen
Financial Dashboard
Live U.S. national debt, oil, gold, mortgage rates, and economic indicators in one view.
FINCOM Intelligence Hub
Financial command tools, external data sources, and all economic tracking pages.
All FINCOM Alerts
Full chronological feed of alerts tagged to FINCOM with financial market impact.
Energy & Oil Markets
The Strait of Hormuz closure - blocking about one-quarter of global seaborne oil trade, per the U.S. Energy Information Administration's World Oil Transit Chokepoints analysis - triggered what the International Energy Agency called the largest supply disruption in oil market history. Brent crude peaked near $126 per barrel on April 30, 2026, up roughly 60% since the Iran conflict began on February 28, according to EIA price data. A U.S.-Iran memorandum of understanding reopened the strait to commercial traffic from mid-June 2026, but that agreement broke down in early July and the waterway was effectively closed again, with 8.3 million barrels per day of Gulf output still shut in as of the International Energy Agency's Oil Market Report of August 12, 2026. Oil currently at $125.44/bbl according to EIA data.

Brent Crude
Brent crude trading at $125.44/bbl per barrel. The IEA coordinated a record strategic reserve release, but prices remain elevated. Brent crude futures for the third quarter of 2026 were forecast near $105 by the EIA in early June, before prices eased after US-Iran ceasefire moves, according to the EIA Short-Term Energy Outlook. See the full benchmark comparison and producer rankings.
Gasoline
U.S. national average $4.35/gal according to EIA data, up 16.9% over the past 30 weeks. At current prices, the average household driving 13,500 miles annually spends approximately $2,327 on gasoline, based on EIA consumption data. Compare pump prices across 50 countries.
Supply Chain
Nitrogen fertilizer prices rose 18 to 25% from late February to March, with urea up more than 40%; anhydrous ammonia later peaked above $1,100 per ton before easing, according to University of Illinois farmdoc data. Energy war escalation after the March 18 South Pars gas field strike created secondary effects across natural gas, oil markets, and petrochemical feedstocks. Supply chain disruption insurance claims are rising as energy supply volatility ripples through manufacturing and logistics.

Gold & Precious Metals
Gold currently trades at $4,194.61/oz - off January's record high but still historically elevated, driven by geopolitical risk, central bank accumulation, and investor hedging.

Gold Spot
Gold at $4,194.61/oz. Gold-backed ETFs drew roughly $12 billion in net inflows globally in Q1 2026, reflecting institutional portfolio hedging against geopolitical risk, according to the World Gold Council. See live gold price tracker, central bank reserves by country, and safe-haven demand analysis.
Central Banks
Central bank gold purchases are projected near 700 to 900 tonnes for 2026 (World Gold Council), down from the 1,000-plus tonne peaks of 2022 to 2024 but still well above the 2010 to 2021 average of about 473 tonnes. China, India, and Gulf states are leading accumulation, with central bank buying running well above historic norms for the fourth consecutive year.
Silver & Platinum
Silver and platinum have followed similar upward price trajectories as gold. Industrial demand for silver in solar panel and electronics manufacturing adds a supply dimension beyond safe-haven buying, as industrial applications account for the majority of annual silver consumption globally.
Defense & Security Sector
Global military spending reached $2.887 trillion in 2025, a 2.9% real-terms increase and the eleventh consecutive year of growth, according to the SIPRI April 2026 release. For the first time in NATO history, all 32 member nations met or exceeded the 2% GDP defense spending target, with European Allies and Canada increasing defense spending 20% over 2024, to more than $574 billion. Japan approved a record defense budget for fiscal 2026, the fourth year of its five-year buildup program and an increase of roughly 4% over the prior year at about 1.9% of GDP, after briefly reaching the 2% level via a fiscal 2025 supplemental, according to the Japanese Ministry of Defense.
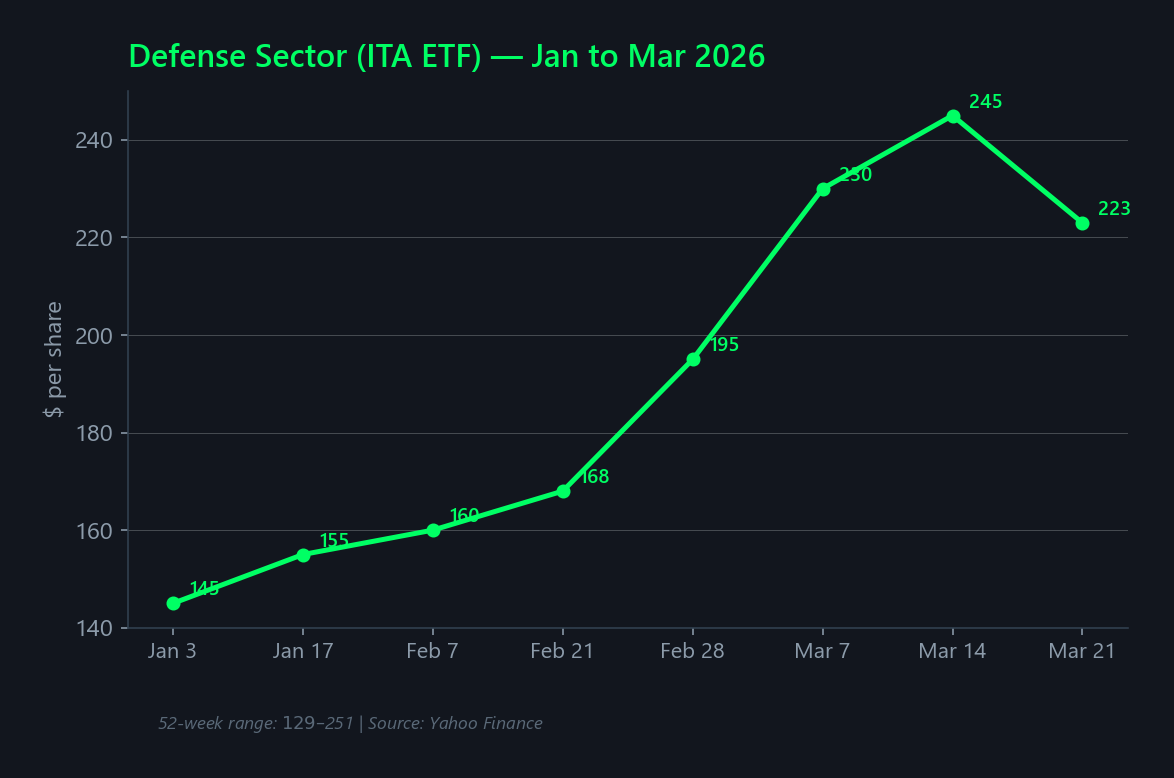
Defense Equities
The FY2026 defense budget exceeds one trillion dollars for the first time, combining roughly 839 billion dollars in enacted appropriations with 152 billion dollars in reconciliation funding. Lockheed Martin reported a record order backlog of about 230 billion dollars as of the second quarter of 2026, driven by F-35, hypersonics, and missile defense contracts. Northrop Grumman's backlog reached a record 104.7 billion dollars as of the second quarter of 2026, anchored by B-21 Raider production and space systems. The Golden Dome missile defense initiative is projected at 185 billion dollars over roughly a decade, though the Congressional Budget Office estimates the full system could cost far more over twenty years.
Global Defense Spending
Global military spending reached $2.887 trillion in 2025, a 2.9% real-terms increase and the eleventh consecutive year of growth, according to the SIPRI April 2026 release.
Cybersecurity
Cybersecurity demand rising alongside conventional and hybrid operations. CISA maintains elevated advisory posture for energy, financial, and defense networks, with a joint April 2026 advisory, last updated July 2026, warning water, energy, and government-facility operators of Iranian ICS targeting. Global cybersecurity spending is projected to reach 244 billion dollars in 2026, up 13.3% year over year, according to Gartner.
Treasury Yields & Interest Rates
Treasury yields reflect market expectations for economic growth, inflation, and geopolitical risk. The 10-year yield drives mortgage rates, corporate borrowing costs, and government debt service. The 2-year yield tracks Federal Reserve policy expectations. When yields diverge sharply, it signals market uncertainty about the economic outlook.


10-Year Treasury
The 10-year yield stands at 5.22%, driven higher by Middle East escalation concerns and persistent inflation expectations. Elevated yields increase the federal government's debt service costs, with the Congressional Budget Office projecting net interest payments will exceed $1 trillion in FY2026. Mortgage rates, corporate bond yields, and auto loan rates all track the 10-year benchmark.
Mortgage Rates
The 30-year fixed mortgage averages 7.40% according to Freddie Mac. At that rate, the monthly payment on a $400,000 loan is approximately $2,770, hundreds more than the same loan at 3.0% in early 2022. Housing affordability remains near historic lows as elevated rates compound with rising home prices.
Fed Policy Outlook
The Federal Reserve holds the federal funds rate at 3.75%, citing persistent inflation risk from energy price shocks. CME FedWatch data shows markets pricing a high probability of no rate cut at the Fed's next meeting, with officials' latest projections, as of June 2026, pointing to a federal funds rate near 3.8% by year-end 2026. The 2-year/10-year yield spread has widened to about half a percentage point, no longer near zero, reflecting uncertainty about whether the current conflict-driven inflation will prove transitory or structural.
Household Financial Readiness
Geopolitical crises create cascading financial effects across all economies - rising energy costs, supply chain disruptions, and inflation pressure that compound for households worldwide. These are practical steps based on current conditions at DEFCON 3.
Cash & Liquidity
Maintain 30-90 days of essential expenses in accessible accounts. ATM networks and digital payment systems can be disrupted by cyberattacks or infrastructure failures. Physical cash covers the gap. FDIC-insured high-yield savings accounts currently offer 3.5-4.0% APY while maintaining full federal deposit insurance protection up to $250,000, based on current Federal Reserve rate data.
Insurance Review
Review homeowner, auto, and health coverage for conflict-related exclusions. Confirm flood and disaster riders are active. Document assets with photos stored off-site or in encrypted cloud storage. Homeowner insurance premiums have continued to climb, with war and terrorism exclusion clauses expanding across carriers, leaving potential coverage gaps that policyholders may not discover until filing a claim.
Essential Documents
Passports, birth certificates, insurance policies, financial account numbers, and medical records in fireproof storage with a second copy off-site. Digital backups on encrypted drives. Identity theft protection services ($10-$30/month) that include dark web monitoring and fraud loss insurance are increasingly part of household financial planning during elevated threat conditions.